Understanding Landscape Connectivity through Graph Theory
Written on
Conservation initiatives have long utilized ecological modeling to guide actions. To effectively implement conservation strategies, it is essential to anticipate future outcomes in light of habitat fragmentation.
Network analysis serves as an essential tool in ecology by integrating the dynamics of habitat patches, their distribution, and suitability into a comprehensive landscape analysis. By employing graph theory, researchers can perform connectivity assessments to identify critical patches in landscape networks, ultimately enhancing our understanding of species movements in fragmented habitats like urban areas.
This article presents a case study on using network analysis to prioritize landscape areas for a vulnerable amphibian species.
Contents: I. Landscape Connectivity and Animal Movements 1.1 Amphibian Migration Movements 1.2 Importance of Identifying High-Quality Habitat (HQH) II. Connectivity Modelling Using Graph Theory III. Mitigation Implications and Conclusions
I. Landscape Connectivity and Animal Movements
Modeling landscape connectivity encompasses both structural and functional aspects of the environment. This approach is vital for predicting future scenarios where animal presence and movements may be compromised due to human activities.
Structural connectivity pertains to the physical layout of the landscape, such as terrain and the placement of infrastructure like roads and railways. Conversely, functional connectivity relates to the behavioral traits of wildlife as they navigate through these structural elements, which includes factors like migration distances and avoidance behaviors.
Roads pose significant threats to amphibian species that breed in ponds, disrupting their movements during critical times of the year and leading to increased mortality. To mitigate this issue, corridors are established to facilitate the restoration of movement and connectivity.
Graph theory is employed to analyze changes in both structural and functional connectivity, allowing for the ranking of movement corridors based on varying migration and dispersal distances. This methodology is particularly useful when examining regions with diverse urban and rural development stages, as it helps identify where infrastructures create barriers to species movement.
The objective of this article is to demonstrate how graph theory can model species movements across two fragmentation scenarios to inform conservation strategies. The study will focus on:
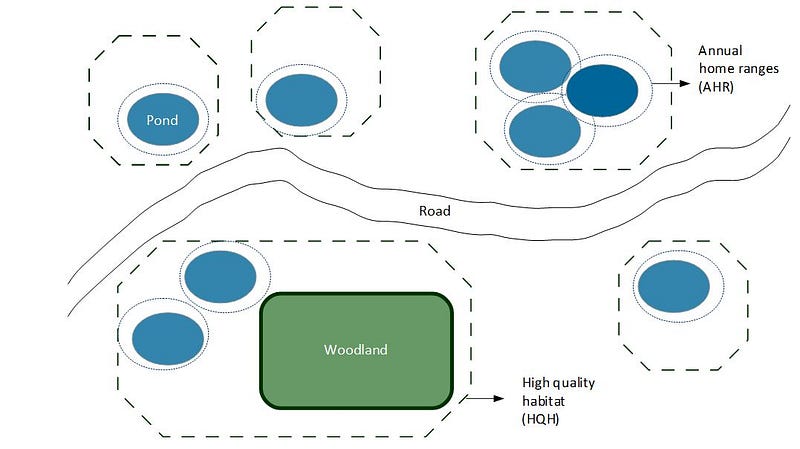
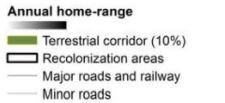
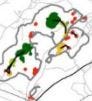
- Migration movements using annual home ranges (AHR) — areas where species access resources needed to complete their life cycle (Level 1 patches).
- High-quality habitat (HQH) areas — regions deemed suitable for species presence and dispersal (Level 2 patches).
- Movements between AHR and HQH areas under two road permeability scenarios (links and edges).
- Functional connectivity analysis using graph theory to prioritize migration and dispersal movements for the amphibian species (prioritizing patches).
1.1 Amphibian Migration Movements
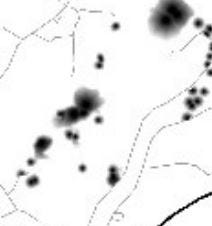
To begin, it is crucial to evaluate patches that include functional connectivity. These patches will help calculate the potential dispersal areas surrounding ponds with documented amphibian presence.
Annual home ranges (AHR) represent areas that provide essential resources for species throughout the year, including foraging, breeding, and hibernation habitats. The extent of each AHR is determined using least-cost distance analysis based on a 10 m resolution friction surface, which assigns varying movement costs (or 'resistances').
Data source: The survey sites included all known locations of the species. Software: Analysis was performed using ArcGIS 10.1 Spatial Analyst.
1.2 Importance of Identifying High-Quality Habitat (HQH)
High-quality habitats (HQH) encompass both aquatic and terrestrial environments that are favorable for the species. By utilizing species distribution models (SDMs), we can pinpoint these HQH areas, which are typically associated with natural landscapes like woodlands, scrublands, and grasslands adjacent to forests and wetlands. These regions also serve as potential movement corridors for migration and dispersal under different fragmentation scenarios.
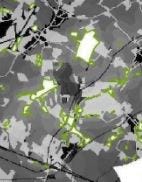
To produce two habitat fragmentation output sets (SI and SII), a cost surface was applied to both AHR and HQH. Scenario SI assumes low suitability across all linear infrastructures, while scenario SII assigns low suitability only to major roads and railways, allowing minor roads to maintain higher suitability scores.
The cost-distance surface was then reclassified into a permeability grid, with the resulting corridors overlaid on AHR and HQH areas to form contiguous habitat patches referred to as 'core areas'. Clusters of corridors are identified through component analysis, which assesses a network of corridors based on a defined dispersal distance.
Data source: Roads and railways data were supplied by the national transport department; land cover variables were sourced from national geographical datasets at a 10 m resolution, and pond spatial information was obtained from a local biological records center. Software: Overall suitability scores were derived using Corridor Design for ArcGIS 10.1 and analyzed in ArcGIS 10.1 Spatial Analyst.
II. Connectivity Modelling Using Graph Theory
Patches and links form the basis of a graph. In this context, nodes represent individual components within the network, while links illustrate the connectivity between these nodes. Suitable dispersal habitats identified through SDMs connect to AHR patches, thereby depicting the landscape network.
An Integral Index of Connectivity (IIC) was utilized to evaluate landscape connectivity and highlight priority habitat patches. This index is based on attributes of individual patches and the weighted links connecting them. Attributes pertain to habitat quality, species presence, and proximity to other high-quality areas. By assessing the IIC after removing each patch, we can determine the relative significance of each patch (dIIC) within the network.
The dIIC score indicates the patch's importance to the overall network—higher values signify greater significance. This index is calculated using the landscape permeability surface for both fragmentation scenarios (SI and SII), utilizing two scales (400 m and 1000 m) to evaluate functional aspects of the landscape pertinent to amphibian movement.
The findings categorize AHR patches into 'priority', 'high', 'medium', and 'low' based on their role in maintaining connectivity within the patch network.
Data source: AHR patches (nodes) connected through suitable dispersal habitat generated in the SDMs. Software: Analyses were conducted using Conefor 26 and MatrixGreen 1.7.
III. Mitigation Implications and Conclusions
Graph theory enables the identification of significant species patches across various scales and landscape contexts.
Results can vary greatly depending on species ecology and landscape characteristics. To formulate effective management strategies, it's essential to examine regional-scale patch networks. The habitat network reflects the dynamics of the landscape for the focal species and provides concise insights for addressing landscape-related questions.
However, uncertainties must be acknowledged, such as:
- Stochastic effects were not considered in our models.
- Post-data collection land use changes could alter the network.
- The terrestrial corridors and connectivity index are specific to this study site.
Graph theory emerges as a valuable tool that integrates both structural and functional connectivity into a coherent network structure. This innovative methodology informs about seasonality, behavioral responses, and actual landscape features.
Ultimately, potential connectivity analyses can yield vital insights into ecological dynamics prior to the execution of mitigation strategies.